


Discussion > Suspicious Low Margin of Error on 100 year temperature comparisons
Unfortunately, as is well documented, the usual temperature records are subject to so many confounding factors as well as potential anthropogenic interference in terms of attempts to 'make things equal'. The nearest neighbour techniques have obvious flaws as do corrections assuming some sort of UHI effect, even if they do that. Roy Spencer's record is the only one that offers a like for like (assuming algorithms and calibrations are not introducing systematic bias), as far as I can tell. How on earth we make any sense of it all is anyone's guess, best not to is my suggestion. Seems to me, I spy a cyclical trend superimposed on a slight warming over the last 140 years, once urbanisation went out of control and mans attempts to 'fix' the problems became apparent all bets were off. Look at the cycles from the late 1800's up until 1960, then something went wrong and as far as I can tell it's the trickery Mickery of the pseudo statisticians trying to fix something, maybe in their favourite direction or otherwise. The bottom line is we cannot gleam anything from the historical records. We can't even measure the temperature and compare to anything anymore. Apart from Roy's work that is.
Feb 26, 2014 at 8:09 PM | David Shaw
 stewgreen
Also transposed from today'scthread "Communicating the pause"
Comment by Corbett
"I commented on her blog and I'll summarise here what the reality is:
The Pause is undefined. There is no Pause; there is a Pause...who cares? - What is real is that the errors in temperature the measurement are going to be at least ± 0.5° C and that is systematic error. No amount of repeated measurements are going to reduce that error. And it could be bigger.
Anomalies are going to have an error of at least ± 0.7°C. I think it's time people who claim to either do science or appreciate it actually put their money where their mouth is and stop perpetrating this anomaly myth.
The only reason it is talked about is that AGW theory defines changes of 0.2°C/decade. But that cannot be measured.
The anomaly is based on ideal measurements that exist in LaLa land. And importantly every time that graph goes up it needs
Every paragraph, every sentence and every word is discussing THEORY. Not reality. Reality gives us absolute temperatures and that's it. Same as every other climate variable. Large errors relative to theory which means we don't know anything.
If this blog is to properly take the sceptic side, stop with this anomaly nonsense. The temperature could have been falling since 1940 for all we know.
Don't be sucked into the argument just so people can spend more money on computer programs rather than being out in the field taking measurements.
And just to finish: this is not science. It is not science it is theory. If they want to make it science then they put a big disclaimer on the graph and say "This is an ideal representation not borne out my measurement"
See how the public like it then.
Feb 26, 2014 at 8:27 PM | Micky H Corbett
stewgreen
It is not science it is theory speculation.
Martin A
To clarify, the satellites in question are not measuring temperature, they are measuring microwave radiation which is correlated to temperature in a way which is not made clear in the Spencer article. The article appears to state that the actual surface temperature readings are NOT used to calibrate the satellite results.
EM claimed it is not surface radiation they are measuring, I quoted the part of the article which says it is. (They are also measuring atmospheric radiation as well)
I do not think it is reasonable to compare satellite measurements with the historic temperature record.
On the question of accuracy, the Spencer article mentions several sources of error which are "corrected" so as usual we do not have reliable raw data.
For reference, the article is here
NW
Informative looking article on 60GHz radiation by oxygen.
If you are a satellite looking directly downwards on a spot in daylight, I wonder how much of the 60GHz radiation you see is
1. From oxygen
2. Thermal radiation from the ground
3. Reflected 60GHz radiation from the Sun.
Martin A
The land thermometer record is not the surface record in the Stephan-Boltman sense. It is the near-surface record. It measures the lower end of the atmospheric column above it. The discrepancy can be high. Consider a day on holiday in the tropics with a pleasant 26C, a light breeze from the sea but you can't stand on the sand which is too hot. The thermometer reading has more to do with local lapse rate than surface radiation.
ssat
MartinA
The 61GHz emission line from oxygen is in the centimetre microwave range. The sun's output centres around 600 nanometres and Earth's surface emission around 10 micrometres. With no significant quantities of molecular oxygen in either of them, interference is likely to be low compared with the atmospheric signal.
With a directional radiometer stray radiation from space on that spot frequency is also likely to be small.
Ssat
The standard land surface temperature is taken 1.5m off the ground. The lapse rate averages -6C/km.
Since the RSS and UAH lower troposphere records run 0.3C cooler than the surface records, this suggests that they are effectively measuring the air temperature at a height of 50m.
Entropic man
Entropic Man
The 61GHz emission line from oxygen is in the centimetre microwave range. The sun's output centres around 600 nanometres and Earth's surface emission around 10 micrometres.
Any thoughts on on the proposed Wi-Fi standard IEEE 802.11ad will run on the 60 GHz (V band) spectrum for data transfer. Short range because signals in the 57–64 GHz region are subject to a resonance of the oxygen molecule and are severely attenuated (last bit from Wikipedia). For that matter V band in general?
Thanks Sandy
SandyS
MartinA
The 61GHz emission line from oxygen is in the centimetre microwave range. The sun's output centres around 600 nanometres and Earth's surface emission around 10 micrometres. With no significant quantities of molecular oxygen in either of them, interference is likely to be low compared with the atmospheric signal.
With a directional radiometer stray radiation from space on that spot frequency is also likely to be small.
(...)
Feb 27, 2014 at 7:28 PM Entropic man
EM - thanks. Is that just off the top of your head, or have you looked at some actual figures for the spectral density in the 60± 5GHz range for each of the sources I mentioned?
".... With no significant quantities of molecular oxygen in either of them" Dunno. They both produce black body radiation which will have some power in the 60±5GHz band, albeit a tiny proportion of the total.
- I was (I hope it was clear) talking only about radiation around 60± 5GHz range.
- Any fule kno that the ground's thermal emission peaks in the IR range and the sun's in the visible range. Despite that, it's not obvious (to me at least) that, of the total power emitted by the ground per sq m, the portion in the 60± 5 GHz range is necessarily less than the power emitted by oxygen in that range. Ground is pretty opaque and non-reflecting in that range and is probably at least as hot as the oxygen. I can't see (even in its favourite frequency range) oxygen radiating any more effectively than a black body.
- However, I can now see (I think) that any radiation from the sun (reflected upwards from the ground) in the 60±5GHz range probably will be negligible compared with radiation from oxygen in that range.
- Agreed about stray radiation from space being negligible, space being quite a bit colder than the ground.
Martin A
Sandy S
The emission line the satellites use is 61.151GHz. If you transmit close to that frequency it will be absorbed and retransmitted, just as CO2 absorbs and retransmits on 15 micrometres.
That will limit transmission range to, at a guess, 50 m. This would probably be sufficient for local networks.
Given the low power of Wi-Fi transmissions I do not know if they will affect the satellite temperature data. I would guess not, but do not have the detailed technical background to be sure.Better to ask Dr. Spencer directly.
Entropic man
Entropic man: "the RSS and UAH lower troposphere records run 0.3C cooler than the surface records"
Do you have a source for that? I recall looking for absolute satellite measurements a while ago and couldn't find them. Only anomalies.
TIA.
HaroldW
Martin A
I trawled a dozen or so sites. None had detailed information.
I found no reference to surface transmission. If there were much it would interfere with existing mobile phone and Wi-Fi networks, which puts it down at the intensities of the satellite measurents or lower. It would also attenuate at low altitude, only affecting the lower troposphere measurement.
To monitor centimetric radiation at the intensities generated by the Sun would need a small/medium radio telescope. I remember reading somewhere that the Jodrell Bank telescope was replated to allow it to operate in this range and detect molecular oxygen in nebulae.
Ultimately, as I suggested to Sandy S, you would need to ask a professional in the field. It is a bit esoteric for the internet.
Entropic man
Harold W
Never trust your memory.
I found a link here which suggests that the under read is 1.8k.
http://www.google.co.uk/url?sa=t&rct=j&q=difference%20between%20satellite%20and%20ground%20temperatures&source=web&cd=2&ved=0CC8QFjAB&url=http%3A%2F%2Fmodis.gsfc.nasa.gov%2Fsci_team%2Fmeetings%2F201001%2Fpresentations%2Fland%2Fyu.pdf&ei=VroPU9LdKs-A7QafkoG4CQ&usg=AFQjCNEr1_cFmbWzDaRGnoD4g0AIGnrHKg&sig2=klTPyM-WUcDydy8sISsKNg&bvm=bv.61965928,d.ZGU
Roy Spencer puts up a graph here
http://www.drroyspencer.com/wp-content/uploads/CMIP5-90-models-global-Tsfc-vs-obs-thru-2013.png
Showing the UAH running 0.1C under HadCRUt4.
His website gave the UAH satellite anomaly as 0.29C compared with the NOAA value of
0.70C
http://www.ncdc.noaa.gov/sotc/global/2014/1
That puts the satellite data 0.1C, 0.41C or 1.8C below the ground data, depending where you look.
Entropic man
EM I found no reference to surface transmission. If there were much it would interfere with existing mobile phone and Wi-Fi networks, which puts it down at the intensities of the satellite measurents or lower. It would also attenuate at low altitude, only affecting the lower troposphere measurement.
Thanks. Surface radiation at 60±5GHz has got to be there, by black body theory. The reason why radiation from the ground it does not interfere with mobile phones etc is undoubtedly because the noise generated in their receivers completely drowns out the miniscule noise signal radiated by the ground.
I may work it out when I've got an hour or so - I think it involves nothing more than putting values into the Planck formula.
I'm curious because if you are measuring the 60GHz radiation arriving in an upwards direction to measure atmospheric temperature, you have to be assuming that most of the power you receive is radiated by oxygen. Yet, it's not at all obvious to me that the radiation from the ground will be smaller than the radiation from the oxygen.
I assume that it's all been carefully worked out. But crazy things happen, so I'd like to check for myself.
Martin A
Radio receivers of all frequencies pick up natural noise and it is a limiting factor in achievable range. It doesn't interfere in general because the link is designed so that the wanted signal is sufficiently in excess of natural and receiver internal noise for reliable communications.
NW
Martin A
An excellent idea. I look forward to your numbers.
Entropic man
Entropic man (10:45 PM) -
Current NCDC anomaly is 0.70 K, but is relative to a 1901-2000 average; the UAH anomaly of 0.29 K is relative to a 1981-2010 average. When converted to the same baseline they're remarkably close. But I am seeking the difference of absolute temperatures, not anomalies.
Similarly, the close tracking in the Spencer graph of the UAH & HadCRUT4 5-year means are relative to 1979-1983, so that doesn't tell us what absolute difference there might be.
The Yu et al. presentation is more what I was hoping for, comparing absolute temperatures (rather than anomalies). It seems to indicate that the satellite vs. ground temperature difference varies by location. Which is interesting in and of itself. But doesn't say anything about the global indices.
So, I appreciate the effort -- thanks very much -- but I think I have to keep on the quest.
HaroldW
Martin A
Crazy things happen all the time, particularly missing something which later appears obvious. When I saw the 60GHz my first thought was how do they discount all all the man-made noise, normally I also reason that I can't be the first to think of that, however that doesn't mean the team who developed this measuring technique thought of everything.
This is an interesting discussion and hopefully I'll learn a bit more about stuff as a result.
I too will look forward to anything you find out.
Sandy
SandyS
Irrespective of how well you can determine 60 GHz intensities you then have to use a temperature reference which itself will have a larger error - hence your proxy for temperature will carry that error across.
For satellite instruments, typically lab tests are performed in a controlled environment; then fly overs (planes etc) are done on controlled environments in the outside world. For example, Cryosat used sites in the Arctic to calibrate its altimeters.
But as it is outside you can't control as many variables hence the error gets larger. When it comes to live in the field the errors may be even bigger as your corrections get more complicated.
So you might have a great measurement of O2 emission but the corresponding temperature reference/conversion may not be as accurate. Seeing though that you tend to see absolute temperature and often expressed in K, a 1 degree error is pretty good.
But for temperature anomalies, not so much.
Micky H Corbett
I said I might try to work out the ground radiation that gets mixed with the atmospheric radiation used to measure temperature. I try to follow the principle of understanding something before spending time doing calculations about it.
I think I now have a rough understanding of how Dr Spencer's temperature sensor works. Here's my attempt to explain it in a few lines.
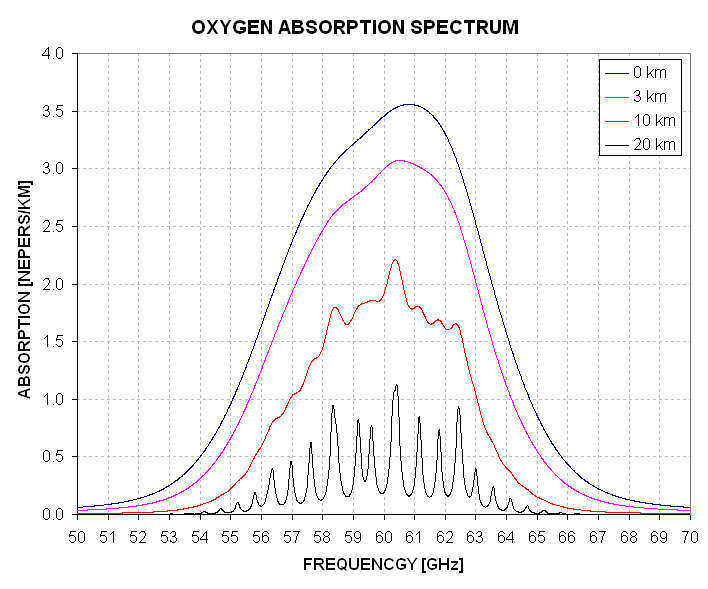
1. Molecular oxygen at low pressure absorbs and emits in a set of closely spaced narrow bands around 60GHz. (The oxygen molecule has a finite magnetic moment and so it can absorb and emit electromagnetic radiation.) Its spectrum, in the microwave range, consists of a succession of narrow peaks centred around 60GHz.
2. At higher pressures, the effects of molecular collisions broaden the closely spaced lines so they become a continuous spectrum - and the overall width (still centred on 60GHz) broadens. The broadening increases with increasing pressure and is maximum at ground level.
Here is a graph showing the oxygen spectrum at various heights.
3. This means that if you measure radiation from gaseous oxygen at around, say 54GHz, it receives radiation from the skirts of the high pressure curves but not from low pressure regions. So (approximately) you can measure the troposphere, independent of stratospheric temperatures. Dr Spencer's 'channel 5' measured the received radiation in a 170MHz band centred on about 54GHz.
4. The total radiation measured is a weighted average of temperatures at different heights (with the weighting function being something that you don't have very much control over ).
The weighting function is probably curve TTS here
Here is the integral for the observed temperature as a weighted average of the temperatures at different heights.
Caption for integral: "This brightness temperature Tb measured by the satellite can be described as an integral over the height above Earth's surface Z of the atmospheric temperature Tatmosphere weighted by a weighting function W(Z), plus a small contribution due to emission by Earth's surface Tsurf."
Note that this equation explicitly includes some radiation from the ground [I have yet to work out how much. 0.1%? 1%? 10%? 30%? ]
My conclusion so far: Satellite ground temperature measurement gives a weighted average temperature from ground level to 20km. So it cannot by any means be the same thing as temperature measured by thermometer at ground level.
Some radiation from the ground level also gets included and will cause a difficult-to-compensate-for error (difficult because the emissivity of the ground varies greatly). The "small contribution due to emission by Earth's Surface" is what I was asking about in an earlier posting and I want to calculate how small it is.
I have consulted and pointed to stuff from the following:
TUTORIAL ON AIRBORNE MICROWAVE TEMPERATURE PROFILERS Bruce L. Gary
Advanced Microwave Sounding Unit-A (AMSU-A) Instrument Guide
How the UAH Global Temperatures Are Produced January 6th, 2010 by Roy W. Spencer, Ph. D.
Martin A
MartinA:
Thanks for the research. I remember having seen the weighting curves before, but couldn't remember where.
You wrote, "The weighting function is probably curve TTS here." The most commonly reported satellite temperature metric -- often referred to simply as "the" UAH or RSS temperature series -- is TLT, the temperature of the lower troposphere. The weighting files for RSS are stored in this directory. In the readme file they write, "For channels TLT and TMT, the surface makes a significant contribution, and must be treated differently for land and ocean scenes." For TLT, the surface weight is around 15% for land and around 12% for ocean, according to those weighting files.
[Ed.: Jos Hagelaars shows RSS TLT land and ocean weighting profiles here.]
I poked around a little with Google but couldn't find the analogous information for the UAH analysis.
HaroldW
HaroldW - Thank you.
One of my references talks about combining (I think with positive and negative weights) several channels. Effectively to try to unscramble the information that has been scrambled from a range of altitudes.
From the sound of it, from the references you give, they change the subtraction depending on what the satellite is looking at, giving the two different weighting curves.
"We have assumed a surface emissivity of 0.90 for land, and have
used a comprehensive sea surface model to calculate the surface
properties for ocean, assuming a wind speed of 8 m/s. The low
emissivity for the nadir and near nadir views for ocean scenes
decreases the surface weight and moves the peak of the weighting
function several hundred meters lower."
This all sounds extremely flaky to me. I thought the whole point of not measuring emission from the ground was that the large variability of its emissivity buggers things up. And in places where the satellite is looking at both ocean and land, presumably one or other weighting will be used, giving another error. It looks to me to be a nightmare of tacky bodges.
From now on, if someone tells me that satellite temperature measurements are more precise than thermometer measurements, I don't think I'll automatically assume that they are correct.
Of course, I might have misinterpreted everything and it might be that their measurements are on a par with what you'd find in a calibration standards laboratory.
[Instead of assuming fixed emissivity values, I'd have thought they'd have been better off removing the component direct from the ground/ocean in the 54GHz measurement by, for example, measuring the radiation from the ground at some frequency outside the O2 band - say 45GHz - correcting its amplitude by a Planck formula computation and then subtracting from the 54GHz measurement to leave only the measurement from O2, with the contribution from the ground completely cancelled.]
Martin A
Martin A
I understand your frustration at realising the limitations of temperature measurement from satellites but think for a second what the measurements are used for in the first instance: to provide absolute temperatures. And for that they are pretty good.
It's only when they are used for anomalies that we get into noise and no-one seems to remember the limitations of the original data. As I said earlier it's because theory is driving the data (and derivation of othe data) not the other way round.
Micky H Corbett
Martin A: "if someone tells me that satellite temperature measurements are more precise than thermometer measurements, I don't think I'll automatically assume that they are correct."
It's certainly fair to say that the satellite measurements are not free of problems of interpretation, any more than surface measurements. Frustrating, but it seems to be so. One need look no further than the fact that UAH and RSS TLT series are not identical, although produced from the same raw data. Take their 30-year trends Jan1984-Dec2013: UAH shows 0.175 K/decade; RSS 0.148 K/decade. That's not a lot, but it's enough to put RSS below the 3 major surface datasets and UAH above those 3. [I should add BEST to the list of major datasets, but haven't yet.]
Also, the algorithms have changed over the years. UAH recently switched to version 5.6 from 5.5. RSS is at version 3.3. One of the key issues seems to be merging observations from different satellites, calibrating one in terms of the other. [Not very different in principle, it seems to me, from surface station records when there has been relocation or changes in equipment or observation method.]
HaroldW
Something that came up on Unthreaded was that temperature comparisons are supposed to be accurate to +/-0.1C
- OK gobal annual average temperatures are probaby higher than 100 years ago.
- OK man-made C02 could be responsible for some of that.
BUT How can this be when those old thermometers were only the same accuracy and there weren't really then enough of them to come up with a temp for the whole globe. One thing that draws me to skepticism is that the alarmist side constantly overplay their hand going beyond what the empirical evidence says. Whereas if their case was so certain, they wouldn't need to do that.
- It seems satellites may get around the not enough sample points problem by being able to sample many points around the globe. But I think the would have to also sample cubes at every altitude to even come up with the heat content of the atmosphere. But then varying heat is contained elsewhere 1. in the oceans. 2. Fresh water 3. Landmass. And without adding them all up how can you truly comoare the heat of the Earth from year to year ?
- Satellite atmosphere temp measurements mabye very accurate as they come from measuring microwaves of oxygen molecules which correspond to their temperature. (From Roy Spencer's explanation) So in sone way their maybe low margins of error in comparing satellite measurements from year to year.. but comparing that with ground based thermometers of 100 years ago sound like you should have a high margin of error.
For a start satellites are measuring oxygen so not surface temp.
NW suggests they can, but I don't understand